TEDxStLouis Rewind: Ness Sandoval on the Power of Maps
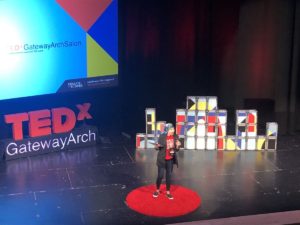
In this 2018 talk from the TEDxStLouis archive Associate director of St. Louis University’s Geospatial Institute, Ness Sandoval, Ph.D. proves that a map is worth a thousand words. He believes in using data, maps and statistics to identify issues such as racial segregation, high poverty neighborhoods.
In this 2018 talk from the TEDxStLouis archive Associate director of St. Louis University’s Geospatial Institute, Ness Sandoval, Ph.D. proves that a map is worth a thousand words. He believes in using data, maps and statistics to identify issues such as racial segregation, high poverty neighborhoods.
Data Speaks
Prof. Sandoval’s passion is in data, maps and statistics. “I speak to data and data speaks to me. I simply use these equations to translate the story that data is trying to tell and I try to tell the story using maps,” he says. “I’m on a journey to share my secret to everyone.”
Social Capital
Sandoval found interest in social economic differences across neighbourhoods. Experiencing firsthand what growing up in a small town in Nebraska, he witnessed spatial divide at the young age of 10.
“I wondered why Latinos were clustered in that one part of the town? why was it considered dangerous?, is it because of vacant lands, decapitated buildings, dying trees? I remember smelling inequality,” he says.
He goes back to the memory of his mother making an authentic Mexican meal on bad days in order to remind the strong sense of community and strong sense of resilience. “Later I learnt that these concepts lead to social capital, an asset that can be used as a catalyst for change,” Prof. Sandoval says.
Mapping Disparities
Demographic concepts such as concentrated poverty, the isolation of racial minorities can be highlighted accurately through maps. According to the professor of sociology, maps are an essential tool to bring change and improve quality of living for those in disadvantaged neighborhoods.
Maps can lead to create different indices such as the social environmental disparity index, one of the indices he created. “We are rooking in the era of big data, we can now work with social, economic, ecological and environmental data and because of maps we are able to synthesize it and integrate it. Now we can use spatial statistics to these maps to identify the patterns that really matter,” he says.
Posts in Saint Louis University (SLU)

Mission Control Acquired by LeagueSpot

Tomorrow: Join SLU and the NGA for the Geo-Resolution 2019 Conference

Recapping the Web: "Silicon Valley Has More Engineers, but the Heartland offers Easier Access to Talent"

With SLU's Big Ideas Challenge Our Minds Are Fixed On the Future of St. Louis

Saint Louis University Becomes First in St. Louis Region to Achieve I-Corps Site Status


Posts in TEDx St. Louis
TEDxGatewayArch Changes Name to TEDxStLouis

The Bourbon Friday Show with Jason Hall from Arch to Park

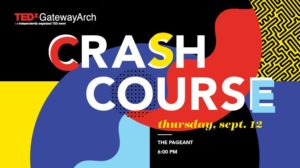
TEDxGatewayArch Chapter Will Host Arts Inspired Mini-Conference on September 12th at The Pageant
The Bourbon Friday Show with Steve Sommers from TEDxGatewayArch
Sharing My Gratitude With Everyone Who Makes TEDxGatewayArch Possible in St. Louis